
In the fast-paced world of aviation, Runway Visual Range (RVR) stands as a non-negotiable metric for ensuring safe takeoffs and landings—especially when adverse weather like fog, heavy rain, or snow reduces visibility. For pilots, air traffic controllers (ATCs), and flight planners, mastering the RVR aviation chart isn’t just a regulatory requirement; it’s a critical skill that directly impacts operational efficiency and passenger safety. This blog breaks down everything you need to know about RVR, from its definition and calculation methods to interpreting the RVR aviation chart and leveraging it for confident flight decisions.
What Is RVR in Aviation?
Before diving into the RVR aviation chart, let’s clarify the core concept: Runway Visual Range (RVR). As defined by the International Civil Aviation Organization (ICAO), RVR is the maximum distance at which a pilot—positioned on the runway’s centerline—can see runway markings (such as centerline stripes or threshold markers) or runway lights during critical flight phases: takeoff and landing.
Unlike general visibility (a broad measurement of horizontal clarity over open terrain), RVR is runway-specific. It focuses on the exact visibility pilots need to align with the runway, avoid obstacles, and execute safe ground operations. For example, if general visibility is reported as 1,000 meters, RVR might be lower if fog is concentrated directly over the runway—a detail that could make or break a landing decision.
Why RVR Matters for Flight Safety
Low-visibility conditions are a top contributor to aviation incidents. Accurate RVR data solves this by:
- Helping pilots determine if they can meet an airport’s minimum visibility requirements (e.g., Category I vs. Category II ILS approaches).
- Enabling ATCs to assign safe runway usage and prevent conflicting operations in low-visibility scenarios.
- Reducing guesswork during pre-flight planning, as RVR values flag potential risks (e.g., sudden fog patches) before departure.

How Is RVR Calculated? Methods & Tools
Calculating RVR requires precision—after all, a 100-meter discrepancy could mean the difference between a safe landing and a diversion. Below are the industry-standard methods and tools used to measure RVR, including advanced systems like Haisen’s BHP01 Transmission RVR Equipment.
1. Traditional Methods
- Human Observer Assessments: Once the primary method, trained personnel at airports visually count visible runway lights or markings from fixed positions (e.g., runway thresholds or control towers). This method is now a backup, as it’s prone to human error in variable weather.
- Weather Station Readings: Basic visibility sensors at airports measure horizontal clarity, but these data are adjusted to reflect runway-specific conditions (e.g., accounting for runway light intensity) to estimate RVR.
2. Automated Systems (Modern Standard)
Automated tools are the gold standard for RVR calculation, as they provide real-time, objective data. The two most common technologies are:
- Transmissometers: These devices use a light source and receiver (placed 500 feet apart, parallel to the runway) to measure how much light is scattered or absorbed by atmospheric particles (fog, rain, snow). The amount of light transmitted directly correlates to visibility—less transmission means lower RVR.
- Scatterometers: Smaller and easier to install than transmissometers, scatterometers measure light scattered by particles in the air. Forward scatter sensors (used widely in the U.S. per FAA standards) are particularly effective in heavy fog or snow, as they capture data without requiring a direct line of sight between the source and receiver.
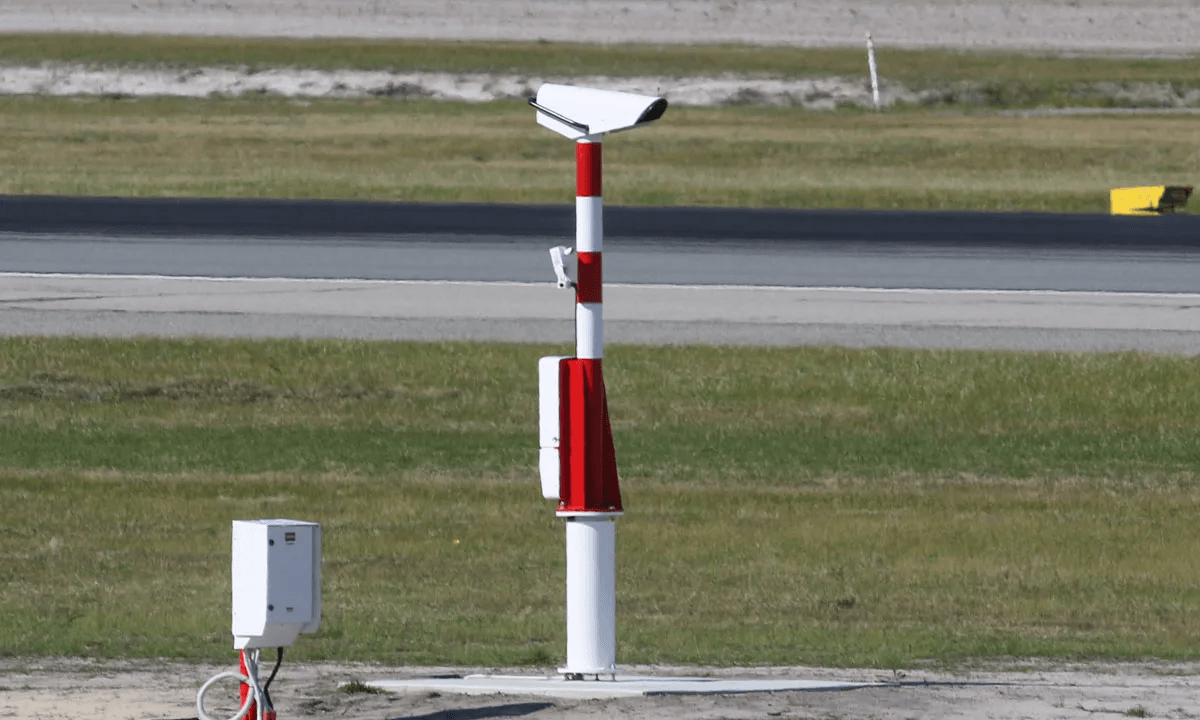
3. Haisen’s BHP01 Transmission RVR Measurement Equipment
For airports prioritizing accuracy in extreme weather, Haisen’s BHP01 system is a game-changer. Designed to meet ICAO standards, it uses a laser light source (wavelength aligned with human vision sensitivity) to measure atmospheric transmission attenuation. Key features include:
- Three components: A laser transmitting end, optical receiving end, and remote control unit—ensuring seamless operation across diverse airport environments.
- Integration of runway light intensity and background brightness data, eliminating discrepancies caused by varying light conditions (e.g., day vs. night).
- Real-time data output to the RVR aviation chart, so pilots and ATCs always have the latest visibility updates.
Practical Example of RVR Calculation
Let’s put this into context: Suppose an airport experiences heavy fog, and a transmissometer measures 40% light transmission over 500 feet. Using ICAO-approved algorithms (and accounting for bright runway centerline lights), the system calculates an RVR of 1,200 feet (≈365 meters). For pilots, this means they can see runway lights up to 1,200 feet—enough to execute a Category I ILS approach (minimum RVR: 1,800 feet with standard lights, or 1,200 feet with enhanced lighting).
What Does 2400 RVR Mean? Interpretation & Implications
One of the most common questions pilots ask is, “What does 2400 RVR mean?” Whether measured in feet (2,400 ft ≈731 meters) or meters (2,400 m ≈7,874 ft), this value signals moderate to good runway visibility—but its implications depend on context.
Interpreting 2400 RVR
- In Feet (2,400 ft): This meets or exceeds the minimum RVR for most Category I ILS approaches (which typically require 1,800–2,400 ft RVR). Pilots can use standard landing procedures without needing special instrument approaches (e.g., Category II).
- In Meters (2,400 m): Far above minimums for all but the most restrictive approaches. Pilots will have clear visibility of runway markings and lights, reducing the need for last-minute adjustments.
Implications for Flight Operations
- Takeoffs: A 2400 RVR means pilots can safely align with the runway and avoid obstacles during rollout. No special takeoff procedures (e.g., reduced thrust) are needed unless other weather factors (e.g., crosswinds) are present.
- Landings: Pilots can use visual references (e.g., touchdown zone markings) earlier in the approach, reducing reliance on instrument guidance. However, they must monitor the RVR aviation chart for drops—fog can reduce visibility to 1,000 ft in minutes.
- Flight Planning: Dispatch teams will flag 2400 RVR as “safe” for the destination airport, but they’ll still include alternate airports in the flight plan (a regulatory requirement) in case visibility deteriorates.
Why 2400 RVR Isn’t “One Size Fits All”
Always cross-reference 2400 RVR with:
- Airport Minimums: Smaller airports with shorter runways may require higher RVR (e.g., 3,000 ft) for safety.
- Weather Trends: If the RVR aviation chart shows 2400 RVR but a “falling” trend (e.g., R 04/2400U in METAR reports, where “U” = rising), pilots should prepare for lower visibility on approach.
- Lighting Conditions: 2400 RVR is more reliable at night with bright runway lights than during dawn/dusk, when background brightness can reduce contrast.
What Is RVR in a Flight Plan? Integration & Regulatory Rules
RVR isn’t just a real-time metric—it’s a critical part of flight planning. Pilots and dispatch teams must incorporate RVR data into every flight plan to ensure compliance and safety.
Incorporating RVR into Flight Planning
1.Pre-Flight RVR Checks: Before departure, pilots review the RVR aviation chart for the departure, destination, and alternate airports. They look for:
- Current RVR values for all runways at the destination.
- Forecast RVR trends (e.g., “RVR decreasing to 1,000 ft by ETA” in TAF reports).
- Minimum RVR requirements for the planned approach (e.g., Category I vs. Category II).
2.Contingency Planning: If the destination’s RVR is forecast to drop below minimums (e.g., from 2,400 ft to 1,500 ft), dispatch teams add an alternate airport with acceptable RVR (e.g., 3,000 ft) to the flight plan.
Regulatory Requirements for RVR
Global aviation bodies like the FAA (U.S.) and ICAO mandate strict rules for RVR usage:
- FAA: Pilots must receive RVR updates from ATC within 10 minutes of approaching the airport in low-visibility conditions. If RVR drops below minimums, the approach must be abandoned.
- ICAO: All airports with instrument approaches (Category I and above) must provide real-time RVR data via the RVR aviation chart. Airlines must train pilots to interpret RVR values and act on deteriorating conditions.
Case Study: RVR in Action
A major airline flight from New York to Chicago faces forecast fog at O’Hare International Airport. Pre-flight checks show O’Hare’s RVR is 2,400 ft (Category I compliant) but forecast to drop to 1,200 ft by ETA. The dispatch team:
- Adds Milwaukee Mitchell International Airport (RVR: 3,000 ft) as an alternate.
- Briefs the pilot to monitor O’Hare’s RVR aviation chart during flight.
- Coordinates with ATC for a priority approach if RVR drops.
Upon arrival, O’Hare’s RVR is 1,400 ft—above Category I minimums. The pilot lands safely, thanks to proactive RVR planning.

The RVR Aviation Chart: Key Components & How to Read It
The RVR aviation chart is the single source of truth for runway visibility. It translates raw RVR data into actionable information— but only if you know how to interpret it.
Key Components of the RVR Aviation Chart
Every RVR aviation chart includes these critical elements:
1.Airport & Runway Identifiers: Clearly labeled runways (e.g., 04L/22R) so pilots can find their target runway quickly.
2.Current RVR Values: Displayed in feet or meters (per airport preference) for three key runway points:
- Touchdown Zone (TDZ): RVR at the runway threshold (most critical for landing).
- Midpoint: RVR at the runway’s center (important for rollout).
- Rollout Zone: RVR at the runway’s end (critical for takeoff).
3.Weather Annotations: Symbols for weather conditions affecting RVR (e.g., “F” for fog, “R” for rain) and trend indicators (e.g., “U” = rising, “D” = falling).
4.Timestamp: The last update time (e.g., “1600Z”) to ensure data freshness.
5.Color Coding: A quick-reference system (e.g., green = safe, yellow = caution, red = unsafe) to highlight RVR levels relative to minimums.

How to Read the RVR Aviation Chart (Step-by-Step)
For a pilot approaching Runway 04L at a foggy airport:
- Locate the Runway: Find “04L” on the chart—its RVR values are listed in a row.
- Check TDZ RVR: The TDZ RVR is 2,000 ft. Since the airport’s Category I minimum is 1,800 ft, this is acceptable.
- Review Trends: The annotation “R 04L/2000D” means RVR is falling. The pilot alerts the crew to prepare for a possible go-around if RVR drops below 1,800 ft.
- Cross-Check Weather: The chart notes “F” (fog), so the pilot expects variable visibility and keeps the runway lights on bright.
Common Mistakes to Avoid
- Ignoring Updates: Relying on a 30-minute-old RVR chart can be dangerous—visibility can change rapidly. Always refresh the chart before final approach.
- Confusing RVR with General Visibility: If the chart shows 2,400 ft RVR but general visibility is 1,000 ft, trust the RVR—it’s runway-specific.
- Overlooking Midpoint/Rollout RVR: A high TDZ RVR (2,400 ft) doesn’t matter if the midpoint RVR is 800 ft—fog in the middle of the runway could block visibility during rollout.
The Future of RVR: Trends Shaping Aviation Safety
As aviation technology evolves, so too will how we measure and use RVR. Here are the top trends to watch:
1. Automated RVR Reporting & AI Integration
The FAA’s Next Generation RVR (NG-RVR) system (deployed since 1995) is being upgraded with AI capabilities. These systems will:
- Predict RVR trends (e.g., “RVR will drop to 1,000 ft in 15 minutes”) using machine learning models trained on historical weather data.
- Integrate with aircraft avionics, so RVR updates appear directly on the pilot’s primary flight display (PFD)—eliminating the need to reference a separate chart.
2. Miniaturized Scatterometers for Small Airports
Smaller, more affordable scatterometers are making RVR data accessible to regional airports that previously relied on human observers. These devices can be installed in hours and require minimal maintenance, improving safety for general aviation.
3. Global RVR Standardization
ICAO’s ongoing work on the second edition of Manual for Runway Visual Range Observing and Reporting Practices (Doc 9328) will standardize RVR measurement and reporting worldwide. This means pilots flying international routes will encounter consistent RVR charts, reducing confusion.

Conclusion: RVR as a Cornerstone of Aviation Safety
For pilots, ATCs, and airport operators, the RVR aviation chart is more than a tool—it’s a lifeline. By understanding what RVR is, how it’s calculated, and how to interpret values like 2400 RVR, aviation professionals can turn low-visibility challenges into safe operations.
Key takeaways:
- RVR is runway-specific: It focuses on the visibility pilots need to land and take off—unlike general visibility.
- Automated tools matter: Systems like Haisen’s BHP01 ensure accuracy in extreme weather.
- The RVR aviation chart is non-negotiable: Always check it for real-time data and trends before every flight.
As technology advances, RVR will become even more integrated into flight operations— but the core goal remains the same: keeping every flight safe, no matter the weather.
