
A practical guide to mobile photometric measurement of airfield ground lighting — the measurement principle, the four settings that decide whether the data is valid, and the operating sequence from vehicle setup to a pass/fail report.
Airfield ground lighting has to be photometrically verified, not just observed to be on. A mobile photometric system does that by driving a bar of 17 lux sensors over each light row at working speed, cutting every beam at a known height and converting the samples into ICAO grid-point intensities and ISO-candela plots. A full runway survey that takes a night with handheld meters takes about an hour with a mobile system, without closing the runway. But the data is only valid if four things are right: bar height within ±10 % of 200 mm, correct camera position for offset lights, the correct CCR step at 6.6 A, and a lateral driving error below ±30 cm. This article walks through all four, then through the software sequence that turns raw lux into a compliance report.
1. Why photometry is an obligation, not a preference
Every light on an airfield is a certified visual aid with a defined photometric performance. A runway centreline light is not simply "a light that works"; it is a light that must deliver a defined minimum average intensity within a defined beam, in a defined colour, aimed at a defined angle. When the lamp ages, when the lens fogs, when the fixture is knocked out of alignment by a snow plough, or when a maintenance crew replaces a halogen fixture with an LED one of a different beam pattern, the light still switches on — and stops complying.
That gap between "illuminated" and "compliant" is what photometric measurement exists to close. It matters operationally because low-visibility operations are certified against the performance of the lighting system: a CAT II or CAT III approval assumes a lighting system that meets its photometric specification. It matters commercially because airports report lighting availability, and it matters legally because the regulator expects evidence rather than assurance.
The traditional method — a technician walking a row with a handheld meter, aiming at each fixture — is accurate but slow, and slow means expensive in the currency that matters most on an airfield: runway occupancy. A centreline row on a 3,500 m runway at 30 m spacing is 117 lights; measuring them one at a time with a handheld meter, including positioning and recording, is a multi-hour exercise that has to be squeezed into a night closure. Mobile measurement compresses that into a drive.
2. What the standard actually asks for
The reference framework is ICAO Annex 14, Volume I (Aerodrome Design and Operations), together with the Airport Design Manual, Doc 9157, Part 4, which sets out how mobile measuring equipment should be used. In practice a compliance assessment compares three things for each fixture: the measured average intensity against the type-specific minimum, the beam geometry — where the main beam is aimed, in azimuth and elevation — against the nominal aiming, and the colour against the chromaticity requirement for that light type.
The system described in this article is specified against ICAO Annex 14 Volume I (7th edition, July 2016), ICAO Doc 9157 Part 4, FAA Advisory Circular AC 150/5340-30H and AC 150/5345-46D, and is certified by the Italian civil aviation authority, ENAC, for the issue of the photometric data it produces. It measures LED and halogen fixtures from 5 W to 315 W, of any brand, and reports intensity, aim and intensity distribution on the ICAO grid, with accuracy and repeatability better than 5 %.
Two details in that sentence carry more weight than they appear to. "Of any brand" matters because airports mix fixture manufacturers across a runway, and a measurement system tied to one brand is a commercial trap. "Better than 5 %" matters because the compliance thresholds themselves are expressed as percentages of a nominal value; a measurement uncertainty of 10 % cannot resolve a light that is 8 % below minimum.
3. System architecture
A mobile photometric system is best understood as four subsystems that have to stay time-aligned: the sensor bar, the distance reference, the position reference, and the processing computer.
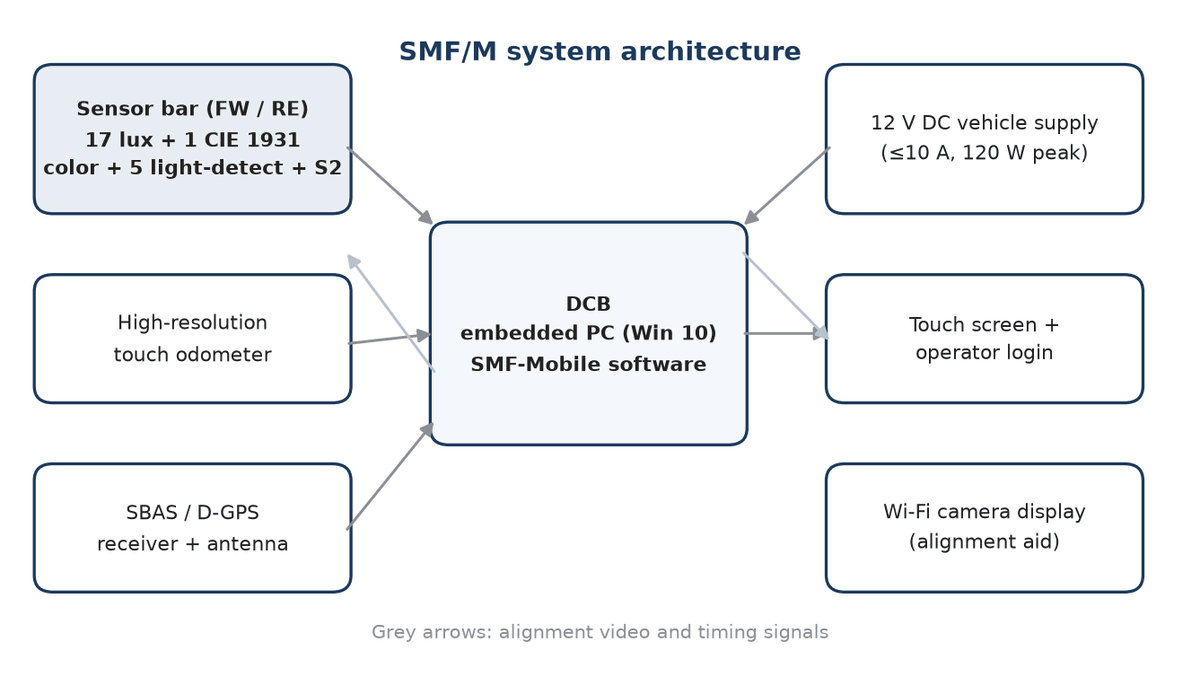
Figure 1 SMF/M system architecture. The sensor bar, odometer and differential GPS all feed the data control box; the alignment camera and touch screen are operator interfaces.
The sensor bar is the instrument. Each bar carries 17 lux sensors distributed across the measuring width, one colour sensor compliant with CIE 1931, five light-detection sensors used to identify that a fixture has been crossed, and one photoelectric sensor dedicated to measuring the height of the lamp relative to the bar. A second bar can be added at the rear for two-bar operation, which allows both directions of a bidirectional light row to be measured in a single pass.
The odometer is a high-resolution contact wheel coupled to the vehicle's rear tyre. It provides the distance axis. The differential GPS receiver — SBAS or local augmentation — provides absolute position so that each measured peak can be matched to a known fixture in the airport database. The data control box houses the embedded computer that runs the acquisition and processing software, and distributes power and timing to everything else.
Table 1 SMF/M governing parameters
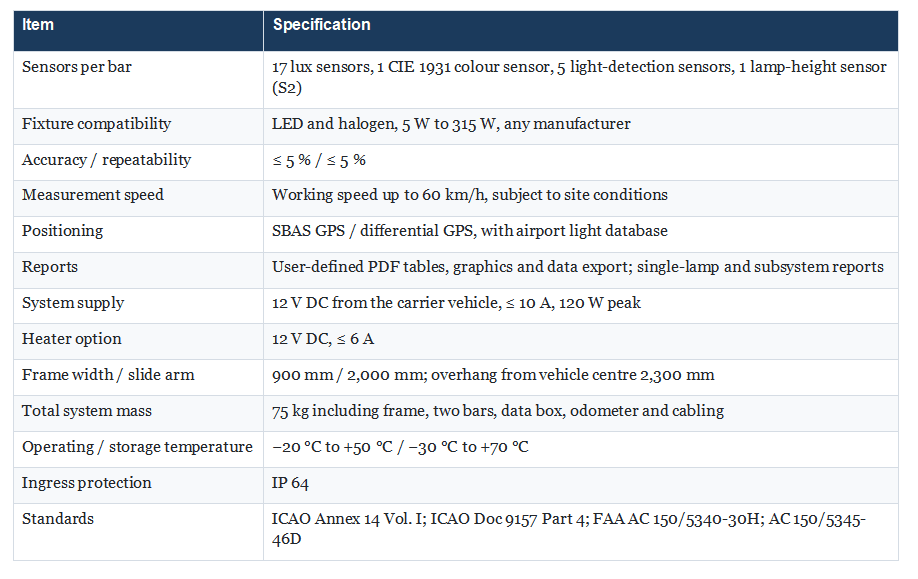
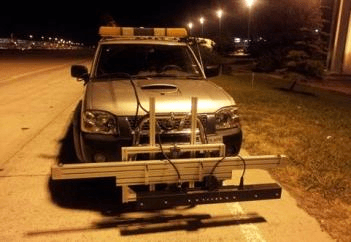
Figure 2 The sensor bar and frame mounted on the carrier vehicle, ready for a night survey. The bar is carried ahead of the vehicle so that the sensors pass over each fixture before the wheels do.
4. The measurement principle: cutting the beam
The system does not aim at a light. It drives a bar of downward-facing sensors along the light row, at a fixed height above the lamps, and lets each beam sweep across the sensor array as the bar approaches, passes and recedes. Because the geometry of the approach is known, the sequence of samples recorded during that sweep can be reconstructed into the angular intensity distribution of the beam.
The bar is mounted orthogonally to the direction of travel and sits about 200 mm above the lamp. As the bar approaches a fixture, the sensor array cuts the beam at a low angle; as it passes over, the cut rises through the beam; as it recedes, the cut falls away again. High-frequency sampling plus a high-resolution distance reference means the angular resolution is set by the sampling rate and the odometer, not by the vehicle speed — which is why the system can work at 60 km/h rather than crawling.
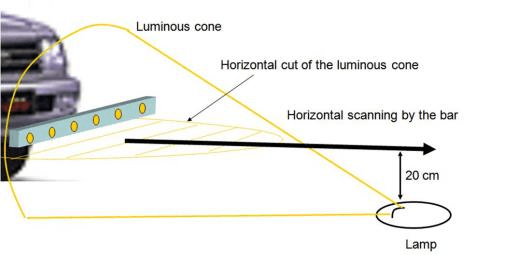
Figure 3 The measurement principle. The luminous cone of each fixture is cut horizontally by the moving bar; the changing geometry of the cut recovers the angular distribution.
A dedicated photoelectric sensor measures the lamp's height relative to the bar continuously, using the same geometry: as the bar moves, the viewing angle to the lamp changes in a predictable way, and the sensor converts that into an exact height. This is what allows the system to correct for bar pitch and roll as the vehicle moves over an uneven shoulder. Without it, a 5 cm height error on a 200 mm nominal height would be a 25 % error in the height term — enough to invalidate the grid-point calculation.

Figure 4 Distribution of the 17 lux sensors along the bar. Spacing is chosen to give the best resolution-to-distance ratio across the measuring width.
Finally, a Wi-Fi camera on top of the bar feeds a display in the cab with a live image of the bar relative to the light row, with a centre line drawn on the screen. The driver steers to keep the lights on that line. This sounds like a convenience feature and is in fact a measurement requirement: lateral error changes the angle at which the beam is cut, and beyond about ±30 cm the reconstruction starts to degrade.
5. The four settings that decide whether the data is valid
Experience with mobile photometry converges on a short list of setup errors that account for most bad surveys. All four are cheap to get right and expensive to get wrong.
5.1 Bar height
The nominal height is 200 mm above the lamp, measured from the centre of the lux sensors to the lamp filament or LED, with a tolerance of ±10 %. Getting this right requires knowing what is being measured: an inset fixture sits at runway level, an elevated edge light does not, and a runway that mixes fixture manufacturers may mix heights as well. This is why a site survey before the first measurement is not optional — it establishes fixture types and heights for every row, and it is the only reliable way to set the bar correctly.
There is a second-order effect that catches crews on shoulder surveys. The runway shoulder is often not at the same elevation as the runway, and it frequently carries a crossfall relative to the runway surface. When the vehicle drives on the shoulder to measure edge lights, the effective distance from bar to lamp drops below the permitted minimum. The correction is to compensate the slope — up to about 1° — by raising the bar roughly 5 cm. This is precisely why the frame needs fine vertical adjustment rather than two fixed positions.
5.2 Bar orientation and camera position
Two independent choices have to be made for each light row: whether the bar is horizontal or vertical, and which of the three camera positions on the bar is used. They are not the same decision and confusing them is common.
· Horizontal bar, centre position — for linear rows without offset: runway centreline, approach centreline within 22.5 m of the centreline, threshold lights, taxiway centreline.
· Horizontal bar, left or right camera position — for linear rows with offset: touchdown zone, runway entrance, approach side row, runway edge lights. The camera goes on the side that matches the offset, so that the camera passes directly over the lamp while the rest of the bar is displaced.
· Vertical bar — for transverse rows: runway entrance, runway end, stop bars, intermediate holding position, and approach crossbars where the ground is accessible.
The camera position matters because the driver aims at the image, not at the lights. If the camera is on the wrong side, the driver will centre the wrong thing, and the entire row will be measured with a systematic lateral offset — data that looks clean and is quietly biased.
5.3 Supply current and CCR step
A photometric measurement is only meaningful at a defined supply current. The convention is 6.6 A, which corresponds to the fifth step of the constant current regulator. Before measuring, the crew confirms with the tower that the circuit is on the correct step and verifies it with a clamp meter at one of the fixtures; if the measured current is below the nominal value, maintenance is notified before the survey proceeds.
A useful sanity check comes free with the first result: if the average intensity across a whole subsystem is markedly lower than previous surveys of the same subsystem, the most likely cause is not that every lamp has aged at once — it is that the circuit is on the wrong CCR step.
5.4 Driving quality
The alignment display gives the driver a target: keep the lamp sequence on the centre line, and keep the lateral deviation at the moment of passage within ±30 cm. Two further rules matter. First, the minimum run-in distance to the first lamp is 13 m for runway lights and 7 m for taxiway lights, because the reconstruction needs a settled approach. Second, on centreline rows spaced 7.5 m apart, odd or even lights must be switched off during the pass, otherwise the sensor array sees two overlapping beams and cannot attribute the samples. Touchdown zone rows follow the same logic: adjacent rows are switched off to reduce cross-talk.
Table 2 Setup matrix by light type
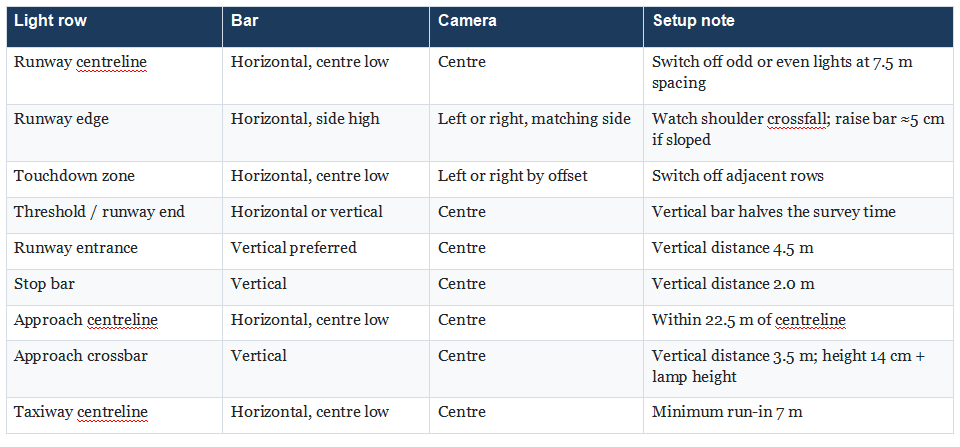
6. The operating sequence, end to end
What follows is the field sequence for a single-bar system. It is worth reading as a whole, because the errors that spoil a survey are usually errors of sequence rather than of technique.
6.1 Power-up and self-check
The data control box is switched on first, which energises the embedded computer, the touch screen and the interfaces. The bar is powered after the computer has booted. The Wi-Fi camera display comes up last; the image should be visible immediately, at a comfortable brightness thanks to the neutral density filter fitted in front of the camera. The software then starts from the touch screen, and the hardware panel is used to confirm that every lux sensor, the colour sensor and the differential GPS receiver are responding before the vehicle moves.
6.2 Operator login
The system requires an operator ID for any measurement. Browsing is permitted without one; measuring is not. This is not bureaucracy — a photometric report that cannot be attributed to a named operator and a measurement campaign is weak evidence in an audit, and the operator ID is what makes the record traceable.
6.3 Selecting what to measure
Two positioning modes are available, and choosing between them is a question of whether the database is already populated and trustworthy.
· Automatic positioning uses the differential GPS position to offer a list of subsystems near the vehicle. It requires a database that already contains the subsystem, and it is the fast path for routine surveys.
· Manual positioning walks the operator down through airport, system, subsystem and row. It is the correct choice for a first survey, for a newly installed subsystem, or whenever the database is in doubt.
"System" in this vocabulary means the runway or taxiway direction — for example 13 or 31. "Subsystem" means a group of adjacent fixtures of the same type on that system: centreline, left edge, right edge, touchdown zone, entrance, end, approach. A single subsystem may contain more than one row, and rows are measured separately; on a runway edge subsystem, row 0 is the driver's left and row 1 the right.
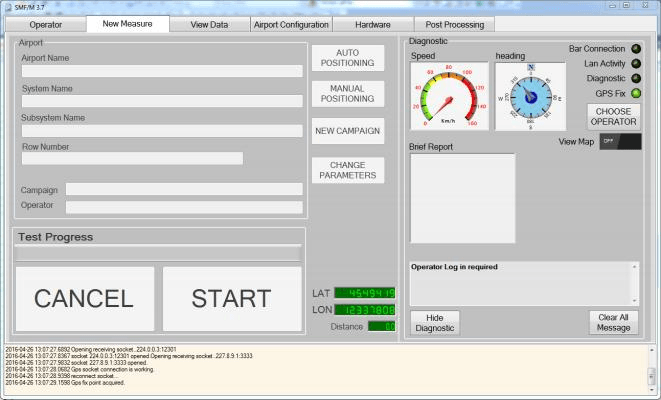
Figure 5 The measurement panel for a single-bar configuration. The left side selects what is being measured; the right side carries the diagnostic indicators and the live map.
6.4 Confirming the test parameters
On the first measurement of a subsystem the software presents the parameters it intends to use, and this is the last point at which a wrong assumption can be caught cheaply. The ones that matter are the bar height in centimetres, the camera position, whether the bar is vertical, the brightness level of the circuit, and whether the photometric evaluation should be centred on the nominal or the measured beam axis.
That last parameter deserves a sentence. If the evaluation is set to centre on the nominal azimuth and elevation, the system assumes the fixture is aimed as designed and evaluates the average intensity in an ellipse centred there; a mis-aimed light will therefore show low intensity. If it is set to centre on the measured beam, the system evaluates the beam on its own axis and reports the aiming error separately. Both are legitimate; they answer different questions. For a compliance survey, the nominal-centred evaluation is the one that matches the regulatory intent, because a badly aimed light is non-compliant even if its beam is bright.
6.5 Running the pass
Once started, the operator drives and nothing else. The display shows progress along the subsystem, the distance covered, GPS latitude and longitude, speed and heading, while the diagnostic pane reports any hardware message. The pass can be suspended and resumed without losing the data already collected, which is what makes it practical to stop for an aircraft crossing or a radio call.
At the end distance the measurement terminates automatically, or the operator stops it manually. The software then offers immediate processing; it is equally acceptable to defer processing to the end of the night, which is often the better choice when several subsystems are being surveyed in one shift.
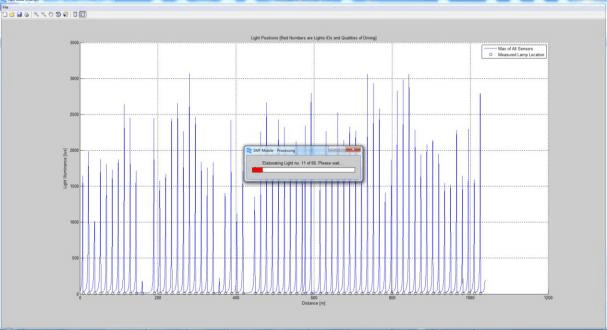
Figure 6 The processing window. Each peak is one fixture; the software matches measured positions to the stored database coordinates and marks the match.
Processing does three things at once: it converts the lux samples into grid-point intensities, it matches each detected peak to a fixture in the database, and it flags the fixtures that fall outside the configured limits. The matching step is shown explicitly — a black circle marks a detected lamp, and a red cross appears when the measured position agrees with the stored coordinate. A missing red cross is the earliest visible sign that the database and the physical airfield have drifted apart, which happens after a taxiway re-designation or a fixture replacement programme.
6.6 Producing the report
The system can print an ISO-candela plot for each fixture; declining the print still stores the photometric parameters in the database, they are simply not rendered as graphics. At the end of the subsystem the main panel shows a summary that states the overall compliance of what was just measured. That summary is generated against the ICAO and EASA parameters held in the system configuration and its resident library, not against values the operator can adjust on the fly — which is what makes the report defensible.
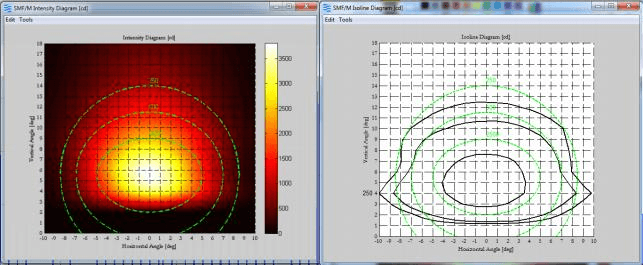
Figure 7 A printed intensity and ISO-candela plot for a single fixture. This is the artefact that goes into a compliance file.
Post-processing produces the documents most airports actually keep: a subsystem data table listing every fixture with its measured intensity, aiming and pass/fail status, a set of graphics that can be limited to the non-compliant fixtures only, and a full-system view for management reporting. The data can be exported, which matters because the photometric record usually has to live in an asset management system rather than in the measuring instrument.
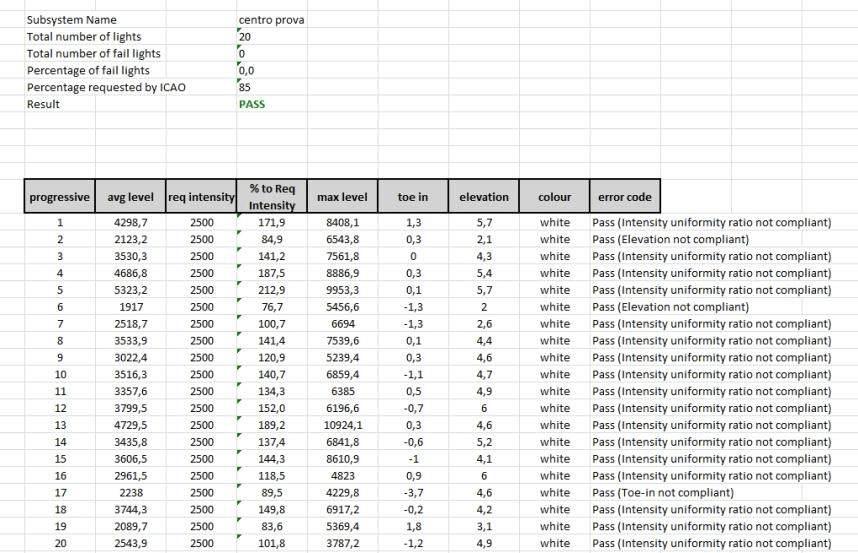
Figure 8 Subsystem report data table. Every fixture carries its own measured values and compliance status, which is what turns a survey into a maintenance work order.
7. Vertical bar mode: the shortcut that is not a compromise
Transverse rows — runway entrance, runway end, stop bars, holding position, approach crossbars — present a different problem. Driving perpendicular to a row of lights that are only a few metres apart is slow and, for elevated fixtures, physically impossible. The solution is to rotate the bar to vertical, drive parallel to the row at a fixed offset, and let the bar's height axis do the work that the direction of travel did before.
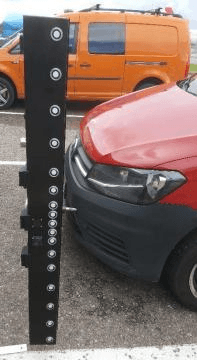
Figure 9 Vertical bar configuration for a transverse light row. The vehicle runs parallel to the row at a fixed distance instead of crossing it.
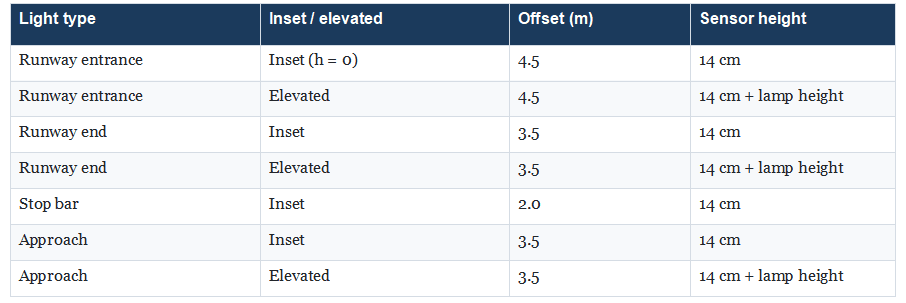
The offset is type-specific, and the values are not interchangeable: 4.5 m for runway entrance lights, 3.5 m for runway end and approach lights, 2.0 m for stop bars. Sensor height is 14 cm above the fixture for inset lights, and 14 cm plus the lamp height for elevated ones. A vertical positioning bracket extending to 2.5 m handles the taller approach fixtures.
Table 3 Vertical bar distances for transverse rows
The gain is substantial. A threshold row measured by crossing it light by light might take twenty minutes; the same row measured with a vertical bar takes one pass. Across a full airport the difference is measured in hours of runway occupancy — which, on a busy hub, is the entire cost argument for mobile photometry.
8. Accuracy, maintenance and the failures that actually happen
A claimed accuracy of 5 % is only credible if the system holds its geometry. The maintenance programme is therefore short but not optional, and almost all of it is about the odometer and the optics.
The odometer wheel wears, and a worn wheel changes the distance scale — which changes the angular reconstruction without producing any visible symptom. Monthly checks cover wheel wear, corrosion on the mechanical assembly, the condition of the gas spring, and lubrication of the moving joints. The frame lead screw is lubricated on the same cycle.
The optics are the other half. Each bar carries 17 lux sensors, a colour sensor, a height sensor and five light-detection sensors, all with a lens that has to be clean before every measurement. Cleaning is done with lens tissue and the specified optical cleaner, and only with those: the height sensor lens must never be rotated, because rotating it changes the calibration of the height measurement.
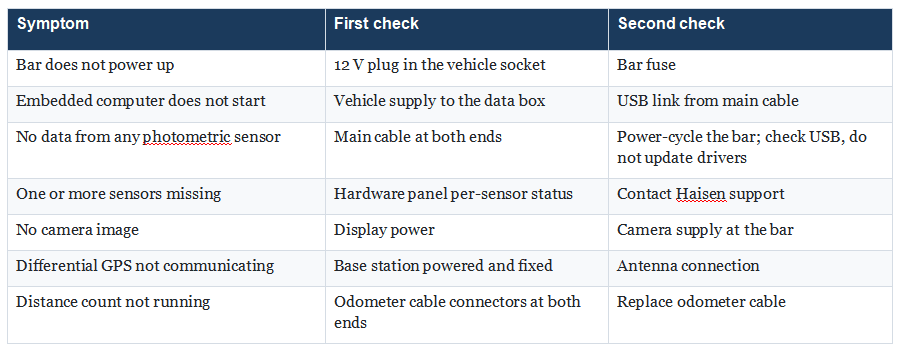
When something does fail, the symptom is usually visible in the hardware panel before it reaches the report. Loss of all photometric data points to the bar cable or the sensor board; loss of a single sensor points to that sensor; a dead distance count points to the odometer cable; no video means the camera supply. The refrigeration-grade advice is the same as for any instrument: do not update the bar firmware casually. The software and the bar electronics are calibrated together.
Table 4 Symptom-to-cause map for field diagnosis
9. Deployment: cadence, timing and the database
The technical capability is only half of a photometric programme. The other half is deciding when to measure and keeping the reference data current.
Weather sets the first constraint: fog, rain and standing water on the pavement all distort the measurement, so surveys are scheduled on dry nights. Runway occupancy sets the second: the work happens in a closure or a low-traffic window, which in practice means at night. The third constraint is seasonal — a survey after the winter snow season and before the low-visibility season is more valuable than a survey in midsummer, because it catches the damage that ploughs and de-icing actually do.
The database is the quiet dependency. Every fixture needs a known position, type, offset and aiming in the system before automatic positioning will work, and the measurement is only as meaningful as that reference. Most operators build it from the airport's as-built lighting drawings, either pre-loaded before delivery or configured jointly with the maintenance team during commissioning. It then has to be maintained: a re-designated taxiway, a rebuilt row, a fixture replacement programme all invalidate parts of it, and the symptom is exactly the missing red cross described earlier.
A practical cadence for most airports is one full-system survey per year, plus targeted surveys after major works, after a fixture replacement campaign, and before a low-visibility season. Airports with high-intensity operations, or with a history of water ingress in fixtures, often go to twice a year. The marginal cost of an extra survey with a mobile system is low; the marginal cost of discovering a non-compliant approach row during a CAT III inspection is not.
10. Acceptance checklist for a photometric system
When a system is delivered, these are the points worth verifying before the acceptance signature. They are also the points a competent supplier should volunteer.
1. The declared standards are named with edition and part — Annex 14 Volume I, Doc 9157 Part 4, the applicable FAA ACs — not summarised as "ICAO compliant".
2. The authority certificate is produced: for this system, the ENAC certification covering the photometric data it issues.
3. A repeatability demonstration is run on a real row, not on a bench: the same subsystem measured twice, with the difference reported per fixture.
4. Bar height calibration is demonstrated against a known fixture, including the offset case for elevated edge lights.
5. The vertical bar configuration is set up and used once for a transverse row during training.
6. A complete report is generated end to end — data table, graphics, export — and opened by the airport's own IT, not just on the vendor laptop.
7. The database is handed over in an editable form, with the import/export path documented, so the airport is not dependent on the supplier for a taxiway re-designation.
8. Fault codes and the hardware panel are explained in the language the local team will use at 03:00.
Frequently asked questions
Does the runway have to be closed for a mobile photometric survey?
No. The system measures at working speeds up to 60 km/h, so a runway survey fits inside a normal low-traffic window rather than a full closure. In practice most surveys are still run at night, because the lighting has to be at the specified CCR step and because the vehicle needs a clear run-in of 13 m before the first runway light.
How long does a full airport survey take?
It depends on the number of rows and how much of the airport is measured, but the practical unit is hours rather than nights. The largest time saving comes from vertical bar mode on transverse rows, where one pass replaces dozens of individual measurements.
Can the system measure LED lights?
Yes. It measures LED and halogen fixtures from 5 W to 315 W of any manufacturer, and reports intensity, colour and beam geometry for both. LED fixtures are generally easier to measure because their output is more stable across the survey, but their beam patterns are narrower, which makes camera alignment slightly less forgiving.
How accurate is it compared with a handheld meter?
The specified accuracy and repeatability are both better than 5 %. A handheld meter can be more accurate on a single fixture measured in ideal conditions, but it cannot compete on coverage: 117 centreline lights measured one at a time produce a sample, not a survey, and the time pressure of a night closure tends to reduce the care taken on the last fifty.
What happens if the airport has no lighting database?
Manual positioning can be used to measure without automatic fixture matching, and a database can be built from as-built drawings and a site survey. Building it properly before the first routine survey is worth the effort: automatic positioning, per-fixture reporting and year-on-year comparison all depend on it.
Why must odd or even lights be switched off on a 7.5 m centreline?
Because the sensor array would otherwise see two overlapping beams within one sampling window and could not attribute the samples to a single fixture. Switching off alternate lights doubles the effective spacing and makes each beam separable. The same logic applies to adjacent touchdown zone rows.
Is ICAO certification of the measuring system required?
ICAO does not certify equipment; it publishes the standards. What matters is that the measuring system is certified by a national authority for the data it produces — for this system, ENAC — and that the resulting photometric report references the ICAO grid and thresholds it was evaluated against.
Planning a photometric survey programme?

Sources and further reading
ICAO Annex 14, Volume I — Aerodrome Design and Operations, 7th edition, July 2016, including Appendix 2 on photometric requirements for approach, runway and taxiway lighting. ICAO Doc 9157, Aerodrome Design Manual, Part 4 — Visual Aids, Chapter 17, on mobile measuring equipment. FAA AC 150/5340-30H and AC 150/5345-46D. SMF/M Operating Manual, Rev. 9.2 (Argos Ingegneria), and the Haisen Technology operating and maintenance manual HT-MN-202611-SMFM, Rev. 1.0, from which the operating sequence, setup parameters and technical data in this article are drawn. Figures 2 to 9 are reproduced from the SMF/M documentation; Figure 1 is drawn by Haisen from the system description.
About the authors: prepared by the Haisen Technology engineering team. Haisen Technology supplies and supports airfield ground lighting measurement systems alongside runway friction testing equipment and airport ground support equipment.